Blog
Reusable Beverage Bottles & Crates Market under PPWR Targets | Global Market Analysis Report

Reusable Beverage Bottles & Crates Market under PPWR Targets Forecast and Outlook 2026 to 2036
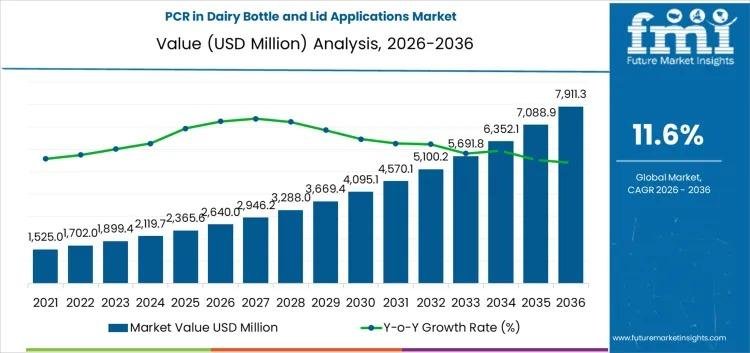
The reusable beverage bottles and crates market is poised for transformative growth as global sustainability mandates shift from recycling to reuse. The industry is currently valued at USD 980.0 million in 2026 and is projected to reach USD 2,341.4 million by 2036, growing at a robust CAGR of 9.1%. This market comprises durable glass and refillable PET bottles, along with the high-density polyethylene (HDPE) crates required to transport them in a closed-loop system. The primary driver is the European Union’s Packaging and Packaging Waste Regulation (PPWR), which sets binding reuse targets for beverages (e.g., 10% for alcoholic and non-alcoholic beverages by 2030), compelling global brands to overhaul their supply chains.
Growth is primarily influenced by the resurgence of deposit-return schemes (DRS) and the standardization of bottle shapes to facilitate universal pooling. In Germany, the pioneer of the “Mehrweg” system, demand is solidifying for Reusable Glass & PET Bottles that can withstand up to 25-50 refill cycles. Simultaneously, in emerging markets like India and China, the on-trade sector (hotels, restaurants, catering) is driving the adoption of robust HDPE Crates to reduce single-use cardboard waste. The market is also witnessing a technological pivot toward Automated crate washing and inspection systems that ensure hygiene standards are met at industrial speeds.
Manufacturers are aggressively scaling production of Refillable PET Bottles utilizing barrier technologies that prevent flavor scalping and extend shelf life. Innovations in Reverse-logistics + sanitisation infrastructure are reducing the carbon footprint of transporting empty bottles, making the reuse model economically competitive with single-use alternatives. Competition is intensifying as packaging giants form consortia to build shared “pool” systems, positioning reusable beverage packaging as the cornerstone of a circular beverage economy through 2036.
Quick Stats for Reusable Beverage Bottles & Crates Market
- Market Value (2026): USD 980.0 million
- Market Forecast Value (2036): USD 2,341.4 million
- Market Forecast CAGR: 9.1%
- Leading End-use: Retail refill & deposit systems (40%)
- Leading Material: Glass / rPET (50%)
- Leading Technology: Reverse-logistics + sanitisation (45%)
- Key Growth Countries: India, China, Germany, Brazil, USA, Japan
- Key Players: Vetropack, ALPLA, Schoeller Allibert, Orbis, Plastipak, Yantai Wanhua, UFlex, Klabin, Toyo Seikan
Reusable Beverage Bottles & Crates Market Key Takeaways
| Metric | Value |
|---|---|
| Industry Size (2026) | USD 980.0 million |
| Industry Value (2036) | USD 2,341.4 million |
| CAGR (2026 to 2036) | 9.1% |
Why is the Demand for Reusable Beverage Packaging Growing?
The primary catalyst for growth is regulatory pressure combined with corporate net-zero commitments. The PPWR’s mandatory reuse quotas act as a forcing function, making “business as usual” with single-use plastics legally and financially untenable in the EU. Beyond compliance, reuse systems offer protection against raw material price volatility; owning a fleet of durable bottles insulates brands from fluctuations in virgin PET or glass prices. Consumer preference is also shifting, with a growing segment of shoppers viewing reusable packaging as a premium, responsible choice. This shift is supported by smart crate technologies that track the location and condition of the fleet, minimizing asset loss and optimizing the return loops.
How Is the Market Structured Across Key Segments?
The market is intricately segmented to address the logistical challenges of returnable packaging. It is primarily categorized by End-use with a focus on retail and hospitality sectors. The Packaging Format segment distinguishes between the primary container (bottles) and the secondary transport unit (crates) while the Material segment differentiates between heavy-duty glass and lightweight refillable PET. Finally, the Technology segment highlights the innovation in cleaning and tracking. Each segment plays a vital role where retail drives bottle durability and logistics drives crate design.
How Does Retail Refill Drive Bottle Design?

The Retail refill & deposit systems segment commands the dominant position and holds a substantial share of the market revenue. This leadership is driven by the established infrastructure in Central Europe and the growing pilot programs in other regions. Reusable Glass & PET Bottles are engineered with thicker walls and scuff-resistant coatings to survive repeated handling by consumers and reverse vending machines (RVMs). Brands prioritize these formats because they offer the lowest environmental impact per liter consumed over the package’s lifecycle.
Which Material Balances Weight and Durability?

Glass / rPET represents the leading material stream. While glass is the traditional choice for beer and premium water due to its inertness, Refillable PET (refPET) is gaining traction for soft drinks due to its lower weight and transport emissions. Manufacturers are developing PET blends with enhanced thermal stability to withstand hot caustic washing without shrinking. The co-existence of these materials allows the market to cater to different beverage categories-glass for image and PET for convenience.
How Does Reverse Logistics Technology Enable Scale?

Reverse-logistics + sanitisation represents the leading technology stream. The economic viability of reuse depends on the efficiency of getting the empty bottle back to the filler. Innovations in Automated crate washing and bottle inspection (using cameras to detect chips or foreign objects) allow filling lines to run at high speeds comparable to single-use lines. This technology ensures product safety and consumer confidence, which are critical for the mass adoption of reusable packaging.
What Specification and Performance Needs Are Driving Demand for Reusable Beverage Bottles & Crates Market under PPWR Targets?
Can Universal Bottles Reduce Logistics Costs?
A major trend reshaping the landscape is the adoption of Standardized “Pool” Bottles. Instead of every brand having a unique bottle shape that must be returned to a specific factory, competitors are agreeing to use a common bottle design that can be refilled by any local bottler. This trend is driven by the need to reduce transport distances and sorting costs. By sharing the asset pool, brands can significantly lower the carbon footprint of the reverse logistics leg, making the reuse model more efficient and scalable.
Does Consumer Convenience Limit Participation?
The most significant restraint is the “friction” of returning empty containers. If the return process is inconvenient, consumers will opt for single-use alternatives. Overcoming this behavioral barrier requires a dense network of collection points and instant deposit refunds. Retailers are investing in advanced Reverse Vending Machines (RVMs) that can accept whole crates or bulk returns, speeding up the process. Digital deposit systems, where consumers scan a QR code at home to claim their refund, are also emerging as a solution to decouple returns from store visits.
How Is Smart Packaging Securing Assets?
The emerging field of IoT-Enabled Crates presents a frontier of opportunity. As crates are valuable assets that often get lost or stolen, there is a growing demand for tracking technologies. Suppliers who can embed low-cost RFID or Bluetooth tags into the crate structure stand to capture a premium market segment. This technology provides real-time visibility into the “float” of packaging assets, allowing supply chain managers to identify bottlenecks and prevent stockouts of empty bottles during peak seasons.
How Is the Reusable Beverage Bottles & Crates Industry Expected to Evolve Across Major Nations?
The global landscape shows a divergent growth pattern. Robust expansion in regulation-driven European markets contrasts with an efficiency-focused, cost-conscious market in emerging economies. High-growth regions are characterized by a strong culture of returnable glass in the informal sector, which is now being formalized. As nations like India and Brazil modernize their beverage supply chains, the adoption of durable crates and hygienic refillable bottles is accelerating. Conversely, mature markets like Germany are optimizing existing systems for higher rotation rates.
| Country | CAGR (2026 to 2036) |
|---|---|
| India | 12.0% |
| China | 10.5% |
| Germany | 9.0% |
| Brazil | 8.0% |
| USA | 7.2% |
| Japan | 5.0% |
Why Is Germany’s Reuse Model Setting the Standard?
The reusable beverage bottles & crates industry in Germany is expected to increase at a CAGR of 9.0% during the forecast period. Germany acts as the regulatory benchmark for the EU’s PPWR targets, maintaining a high quota of reusable packaging despite economic pressures. The Federal Statistical Office (Destatis) reported that producer prices for non-durable consumer goods (including beverages) rose by 1.3% year-on-year in November 2025, reflecting the resilience of the sector. This stability supports the Retail Refill & Deposit Systems, where consumers are accustomed to the “Pfand” (deposit) system. German retailers and bottlers continue to invest in Automated Crate Washing infrastructure to handle the immense volume of returnables efficiently.
How Does US Beverage Shipment Data Support Refill Potential?
The reusable beverage bottles & crates sector in the United States is forecast to rise at a CAGR of 7.2% between 2026 and 2036. The US market is characterized by massive beverage consumption volumes that offer significant potential for circularity if infrastructure improves. The USA Census Bureau reported that manufacturers’ value of shipments for beverage manufacturing reached $12.006 billion in September 2025. This enormous throughput indicates a fertile ground for Reusable Glass & PET Bottles, particularly in the craft brewery and soda sectors. Companies like Orbis and Plastipak are piloting closed-loop crate systems to replace corrugated boxes, aiming to capture value from this high-volume production stream.
What Role Does China’s Catering Revenue Play?
Demand for reusable beverage bottles & crates in China is projected to grow at a CAGR of 10.5% through 2036. The resurgence of social dining and on-premise consumption is a key driver for returnable packaging. The National Bureau of Statistics of China reported that catering revenue reached 605.7 billion yuan in November 2025, an increase of 3.2% year-on-year. This thriving on-trade sector supports the Crates & Carriers segment, where durable HDPE crates are essential for delivering beverages to millions of restaurants and bars. Chinese manufacturers are adopting Automated Crate Washing to meet hygiene standards while servicing this expanding hospitality market.
How Is India’s Food Processing Growth Fueling Reuse?
Sales of reusable beverage bottles & crates in India are anticipated to expand at a CAGR of 12.0% over the forecast period. The government’s push to modernize the food and beverage supply chain is creating opportunities for organized packaging solutions. The Press Information Bureau (PIB) highlighted that the food processing sector’s exports grew at a CAGR of 13.23% (as of 2024-25), with significant capacity additions under the PLI scheme. This industrial scaling drives the Beverage Producers segment to adopt Refillable PET Bottles and standardized crates. The shift from informal logistics to organized supply chains encourages the use of durable, trackable assets that reduce breakage and loss.
How Is Brazil’s Services Sector Utilizing Returnables?
Consumption of reusable beverage bottles & crates in Brazil is projected to grow at a CAGR of 8.0% through 2036. The robust performance of the services sector, particularly tourism and dining, underpins the demand for returnable packaging. The Brazilian Institute of Geography and Statistics (IBGE) reported that the volume of services reached a record peak in September 2025, with tourism activities growing 3.3% year-on-year in July. This economic backdrop supports the Local Refill Schemes, where returnable glass bottles remain popular for beer and soft drinks. UFlex and local partners provide Low-cost Sanitisation technologies that allow regional bottlers to maintain fleets of reusable bottles economically.
Why Is Japan’s Industrial Output Relevant for Crates?
The reusable beverage bottles & crates market in Japan is expected to grow at a CAGR of 5.0% through 2036. Japan’s focus on industrial efficiency and waste reduction aligns with the principles of reusable transport packaging. The Ministry of Economy, Trade and Industry (METI) reported that industrial production increased by 1.4% in October 2025, signaling steady manufacturing activity. This consistency supports the Breweries segment, where standardized, reusable crates are the norm. Japanese manufacturers like Toyo Seikan innovate with Bottle Life-Extension Design, creating ultra-durable containers that fit seamlessly into the country’s highly automated and precise logistics networks.
How Are Companies Competing in Reusable Beverage Bottles & Crates Market under PPWR Targets?
The competitive landscape is defined by the integration of packaging manufacturing with logistics services. Industry leaders like ALPLA and Schoeller Allibert are strengthening their positions by offering “pooling services,” where they manage the entire lifecycle of the crate and bottle fleet for the brand owner. There is also a marked trend toward Material Innovation, with companies developing “unbreakable” glass coatings and molecularly enhanced PET that resists stress cracking during wash cycles.
Mergers and acquisitions are targeted at logistics tech firms, as packaging giants seek to add tracking and asset management capabilities to their hardware offerings. Leading companies are actively investing in washing hubs located near major retail centers to minimize transport emissions. Furthermore, competitive intensity is driving a shift toward System Interoperability, where suppliers design crates that can be used by multiple brands and handled by standard robots, lowering the barrier to entry for the reuse ecosystem.
Key Players in the Reusable Beverage Bottles & Crates Market under PPWR Targets
- Vetropack Holding Ltd
- ALPLA Werke Alwin Lehner GmbH & Co KG
- Schoeller Allibert Services B.V.
- Orbis Corporation
- Plastipak Holdings, Inc.
- Yantai Wanhua
- UFlex Ltd.
- Klabin S.A.
- Toyo Seikan Group Holdings, Ltd.
- DW Reusables
Scope of Report
| Items | Values |
|---|---|
| Quantitative Units | USD Million |
| End-use | Retail refill & deposit systems, On-trade (restaurants, bars), Beverage producers, Local refill schemes, Breweries |
| Packaging Format | Reusable Glass & PET Bottles, Crates & Carriers, Refillable PET Bottles, Reusable Bottles, Standardized Pool Bottles |
| Material | Glass / rPET, HDPE Crates, PET blends, HDPE / PP, Glass with protective coating |
| Technology | Reverse-logistics + sanitisation, Automated crate washing, Bottle life-extension design, Low-cost sanitisation, Smart tracking tags |
| Regions Covered | North America, Latin America, Europe, East Asia, South Asia & Oceania, Middle East & Africa |
| Countries Covered | United States, Canada, Germany, UK, France, Italy, China, Japan, South Korea, India, Brazil, Mexico, GCC Countries, South Africa |
| Key Companies Profiled | Vetropack, ALPLA, Schoeller Allibert, Orbis, Plastipak, Yantai Wanhua, UFlex, Klabin, Toyo Seikan, and others. |
| Additional Attributes | Market share analysis, PPWR impact analysis, regulatory impact analysis, material innovation, and competitive benchmarking. |
Reusable Beverage Bottles & Crates Market by Segments
By End-use:
- Retail refill & deposit systems
- On-trade (restaurants, bars)
- Beverage producers
- Local refill schemes
- Breweries
- Others
By Packaging Format:
- Reusable Glass & PET Bottles
- Crates & Carriers
- Refillable PET Bottles
- Reusable Bottles
- Others
By Material:
- Glass / rPET
- HDPE Crates
- PET blends
- HDPE / PP
- Others
By Technology:
- Reverse-logistics + sanitisation
- Automated crate washing
- Bottle life-extension design
- Low-cost sanitisation
- Others
By Region:
- North America
- Latin America
- Europe
- East Asia
- South Asia & Oceania
- Middle East & Africa
Bibliography
- European Parliament & Council of the European Union. (2025). Regulation (EU) 2025/40 of the European Parliament and of the Council of 19 December 2024 on packaging and packaging waste, amending Regulation (EU) 2019/1020 and Directive (EU) 2019/904, and repealing Directive 94/62/EC (OJ L 2025/40, 22 January 2025). Official Journal of the European Union.
- Eurostat. (2025, October 10). Packaging waste statistics. Statistics Explained, European Commission.
- Sinkko, T., Amadei, A., Venturelli, S., & Ardente, F. (2024). Exploring the environmental performance of alternative food packaging products in the European Union: Life cycle impacts of single-use and multiple-use packaging (EUR 31840 EN). Publications Office of the European Union.
Frequently Asked Questions
How big is the reusable beverage bottles & crates market under ppwr targets in 2026?
The global reusable beverage bottles & crates market under ppwr targets is estimated to be valued at USD 980.0 million in 2026.
What will be the size of reusable beverage bottles & crates market under ppwr targets in 2036?
The market size for the reusable beverage bottles & crates market under ppwr targets is projected to reach USD 2,341.4 million by 2036.
How much will be the reusable beverage bottles & crates market under ppwr targets growth between 2026 and 2036?
The reusable beverage bottles & crates market under ppwr targets is expected to grow at a 9.1% CAGR between 2026 and 2036.
What are the key product types in the reusable beverage bottles & crates market under ppwr targets?
The key product types in reusable beverage bottles & crates market under ppwr targets are retail refill & deposit systems, on-trade (restaurants, bars), beverage producers, local refill schemes, breweries and others.
Which packaging format segment to contribute significant share in the reusable beverage bottles & crates market under ppwr targets in 2026?
In terms of packaging format, reusable glass & pet bottles segment to command 45.0% share in the reusable beverage bottles & crates market under ppwr targets in 2026.